
The economic optimism that emerged in 2021 after the global economy quickly rebounded from the worst days of the pandemic dissipated in 2022. Events around the globe brought a decline in financial markets, and inflation roared. Investors worried about how long the downturn might last, and consumers had to face ever-increasing prices on a broad range of goods and services.
People are naturally concerned about what is in store for 2023. Will a recovery come, or will more volatility tempt people to stockpile cash? Will soaring prices continue to put pressure on household budgets, or is there some relief from inflation around the corner? No one has a crystal ball, but a broad examination of the current state of the economy and financial markets offers some indications of how 2023 may play out. History also offers lessons on how to keep a proper perspective on whatever scenarios ultimately occur.
What Is the “Real” State of the Economy?
The scary “R” word—recession—kept rearing its head last year. Many observers, including 63% of economists surveyed by The Wall Street Journal, have predicted that will be the fate for the U.S. economy in 2023. The technical definition of a recession was already met in the first half of 2022, when the economy experienced negative Gross Domestic Product (GDP) growth for two consecutive calendar quarters. Growth rebounded in the third quarter, though, as the GDP posted a 3.2% gain. Initial estimates for growth in the fourth quarter indicate that the United States’ economic output increased by 2.9%.1
These are promising signs, but they offer no guarantees of what might be in store for 2023. To take the pulse of the economy, it’s important to look at some of the leading economic indicators, as outlined below. An important caveat, though, is that the indicators are often a mixed bag, and taken collectively, they can still leave much room for interpretation.
- Employment levels and job growth: The unemployment rate was just 3.5% in the final month of 2022.2 In fact, it had remained low for all of 2022, an indication that employment levels had sustainably recovered from the disruption caused by the pandemic. Beyond the employment rate, job creation is also a key indicator of whether an economy is growing robustly or slowing down. The U.S. economy closed out 2022 with an increase of 223,000 in nonfarm payrolls, once again beating estimates.3 That is good news for workers, and a positive sign for the overall economy.
- Consumer spending and sentiment. How much consumers are willing to spend is a critical economic indicator because consumer spending drives nearly 70% of the U.S. economy.4 Since COVID-19 lockdowns in the U.S. ended in the summer of 2021, consumer spending has been strong and perhaps helped spare the economy from a prolonged downturn in 2022. (See Exhibit 1).
Exhibit 1: Consumer Spending Has Been Resilient
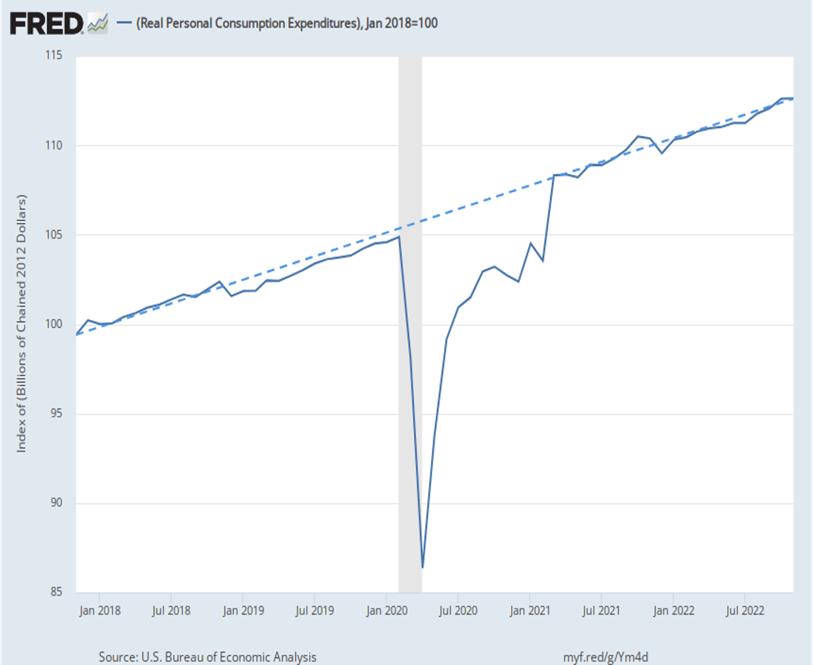
Still, spending, as measured by personal consumption expenditures, dipped slightly in November and December of 2022 (at rates of -0.1% and -.0.2%, respectively).5 That seemed to indicate persistent inflation throughout the year may have finally caused consumers to tighten their belts. How consumers are feeling about the economy also influences how much they’re willing to spend. In January of 2023, a key measure of consumers’ mood, the University of Michigan’s consumer sentiment index, was up nearly 9% from December.6 Even with this turn toward optimism, two-thirds of the consumers surveyed were still expecting an economic downturn at some point in 2023.
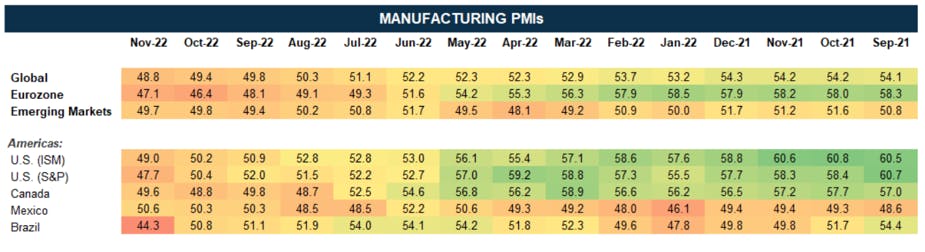
- The outlook of manufacturing purchasing managers. It’s not only consumer sentiment that is a harbinger of economic conditions. The level of supplies purchasing managers at manufacturing companies are willing to buy is also a good gauge, and the Purchasing Managers’ Index (PMI) has proven to be one of the most accurate leading indicators of the economy. A reading of the index at 50 is neutral, anything above 50 suggests conditions are improving, and a number below 50 indicates things are worsening. As Exhibit 2 shows, manufacturing PMIs across the globe declined throughout the year in 2022. In our view, though, the recent below-50 numbers suggest that global manufacturing could be due for a rebound.
Exhibit 2: Global Manufacturing May Be Poised for a Rebound in 2023
- Corporate earnings growth. Whether companies are able to increase their earnings, meaning their profitability, reveals much about the state of the economy. U.S. companies, as well as those in developed international and emerging markets, all experienced a major surge in earnings growth in 2021 as the global economy rebounded strongly from the pandemic-induced slowdown. Last year, in all global markets, earnings growth was much more anemic. The pace at which companies can increase their profitability will be a key metric to watch throughout 2023 to assess whether the U.S. and global economies are headed for an expansion or winding down into a recession.
All these indicators, even if they are mixed, don’t seem to justify the fears of a recession, but there is one continuing major economic factor that is setting the expectations for a slowdown or even contraction in economic output this year—inflation.
Inflation Persists as a Major Threat
The second half of 2022 did bring some consoling news on the inflation front. After reaching a peak in the summer, the inflation rate slowly started to come down during the second half of the year. (See Exhibit 4.) Numbers released early in 2023 showed the decline in the inflation rate continued in December as the year-over-year increase in the Consumer Price Index was 6.5%.7
Exhibit 4: U.S. Inflation Modestly Eased in the Second Half of 2022
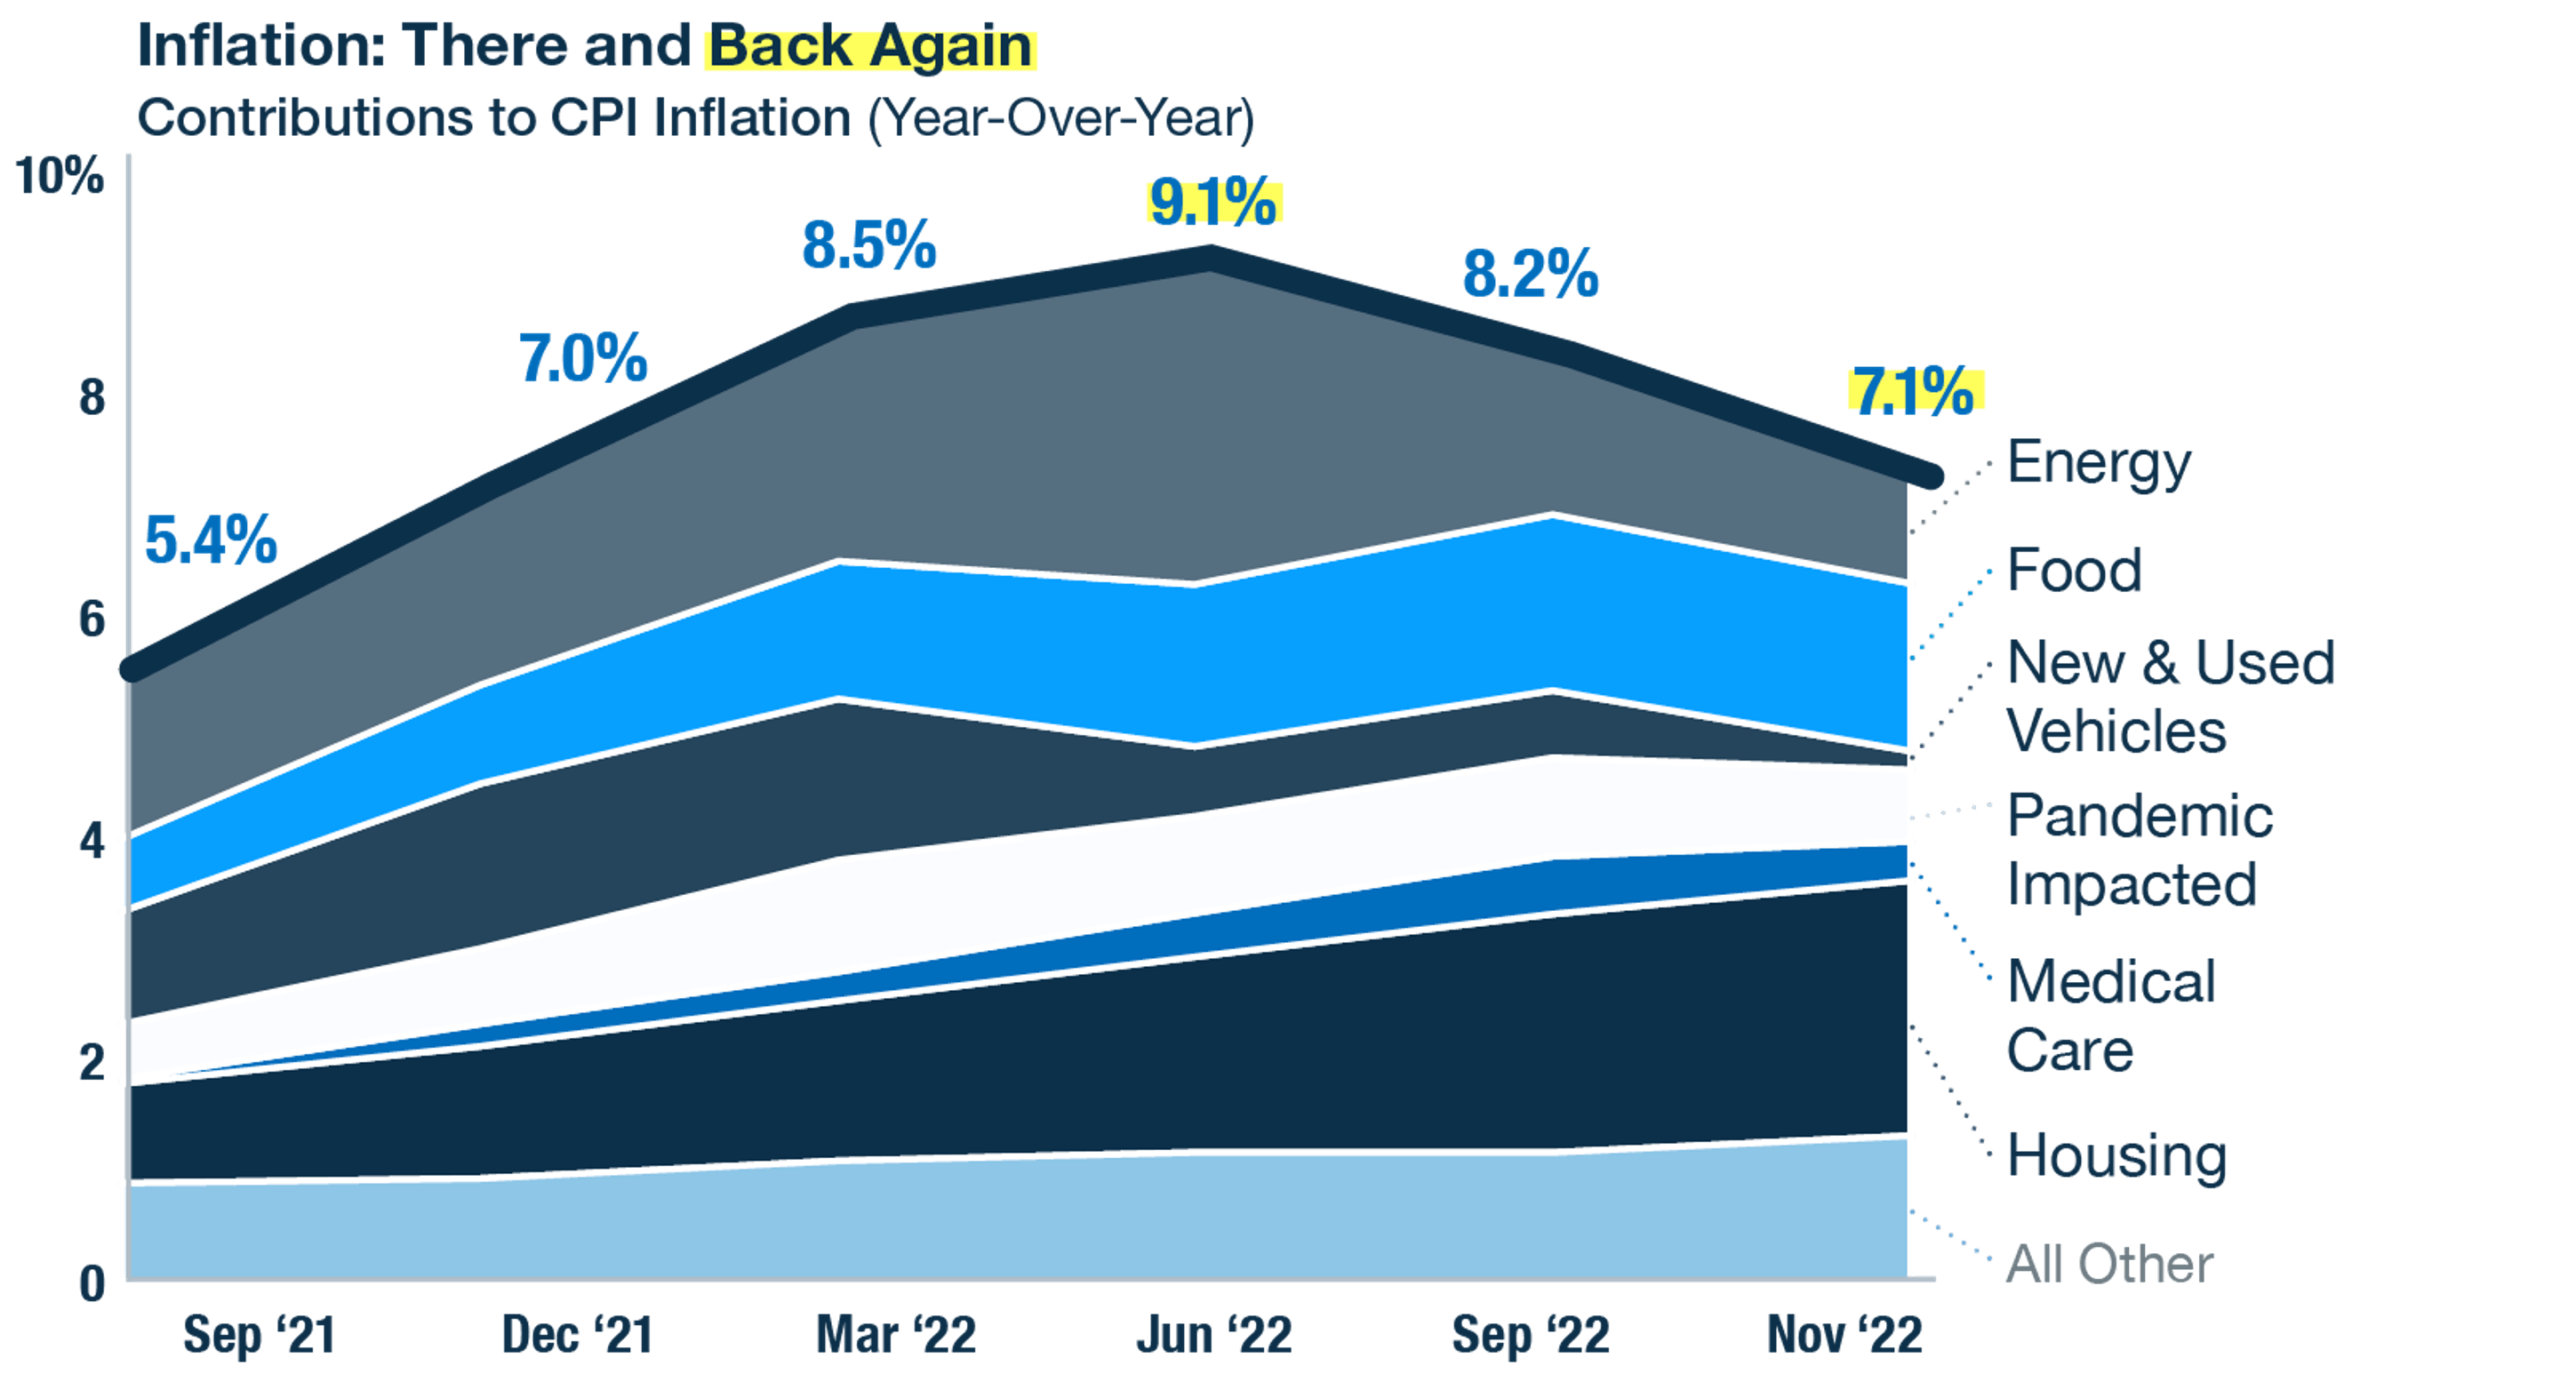
Throughout the year, global supply chain challenges continued to be a driving factor for high inflation. Lockdowns in China in response to spikes in COVID-19 cases negatively affected the supplies of many products, while demand remained high. As every economics class teaches, supply/demand imbalances impact prices. Geopolitical tensions, including Russia’s invasion of Ukraine, also had an inflationary impact. The U.S. Federal Reserve (Fed) aimed to bring inflation under control by a series of aggressive interest rate hikes. While the Fed’s benchmark rate—the federal funds rate—was close to 0% at the start of 2022, the Fed’s rate increases brought it to 4.33% by year’s end.8 More rate increases are expected to come in 2023, given that inflation is still nowhere near the Fed’s target rate of 2%.
Higher interest rates impact all sectors of the economy. They make borrowing more expensive for both consumers and companies. The spike in mortgage rates that came in the aftermath of the Fed rate increases is a primary reason why housing is now one of the weakest sectors of the economy. With the cost of borrowing for homes so high, fewer buyers are in the market, homebuilders have slowed down the construction of new homes, and fewer people are borrowing against the equity in their homes to pay for renovations. All that slowdown in activity ripples across the economy.
The challenge for the Fed is to find the balance between bringing down demand in the overheated sectors of the economy so that inflation declines, without putting the brakes on so hard that the economy veers into a recession.
Gauging the Impact on the Stock and Bond Markets
While inflation and employment levels have a major impact on pocketbook issues, people are also concerned about what is happening with their long-term investments. Most people saw alarming drops in their 401(k) balances in 2022, as the stock market experienced a major drawdown and bonds lost value as interest rates climbed.
Large-cap U.S. stocks, as measured by the Standard & Poor’s 500 Stock Index, declined 18% in 2022, their worst year since 2008.9 Once high-flying technology stocks had an even worse year, as the tech-heavy Nasdaq Index dropped by 33%.10
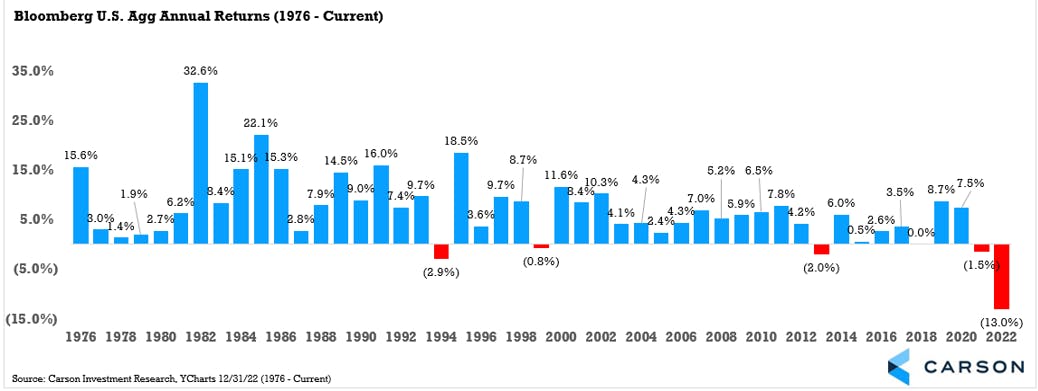
The bond market didn’t provide a safe haven for investors. It has been in a bear market for the past two years, and the decline in the overall bond market last year was so steep that 2022 could deservedly earn the reputation as the worst year ever for bonds. (See Exhibit 5.)
Exhibit 5: A Two-Year Bear Market for Bonds
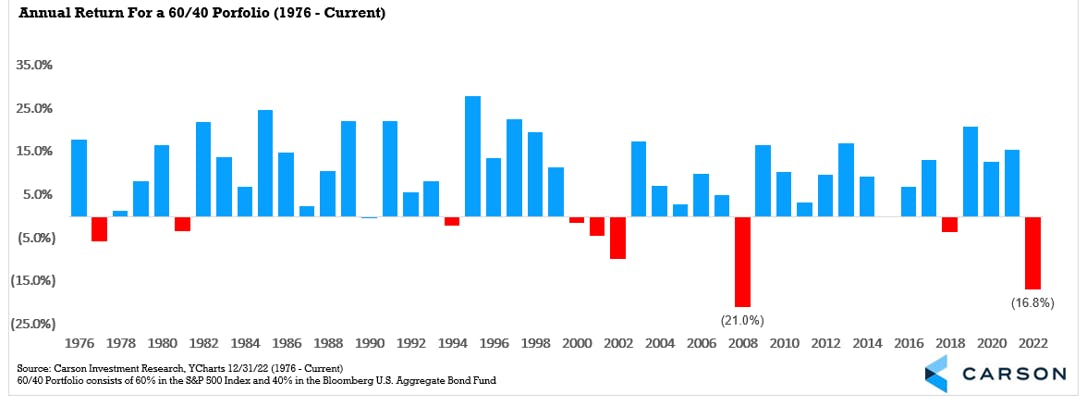
Investors who took a balanced approach by diversifying their portfolios across stocks and bonds didn’t fare very well. The traditional 60% stocks/40% bonds portfolio delivered one of its worst returns in nearly 50 years, surpassed only by the losses it experienced during the Global Financial Crisis of 2008. (See Exhibit 6.)
Exhibit 6: 2022 Was a Difficult Year for Balanced 60/40 Portfolios
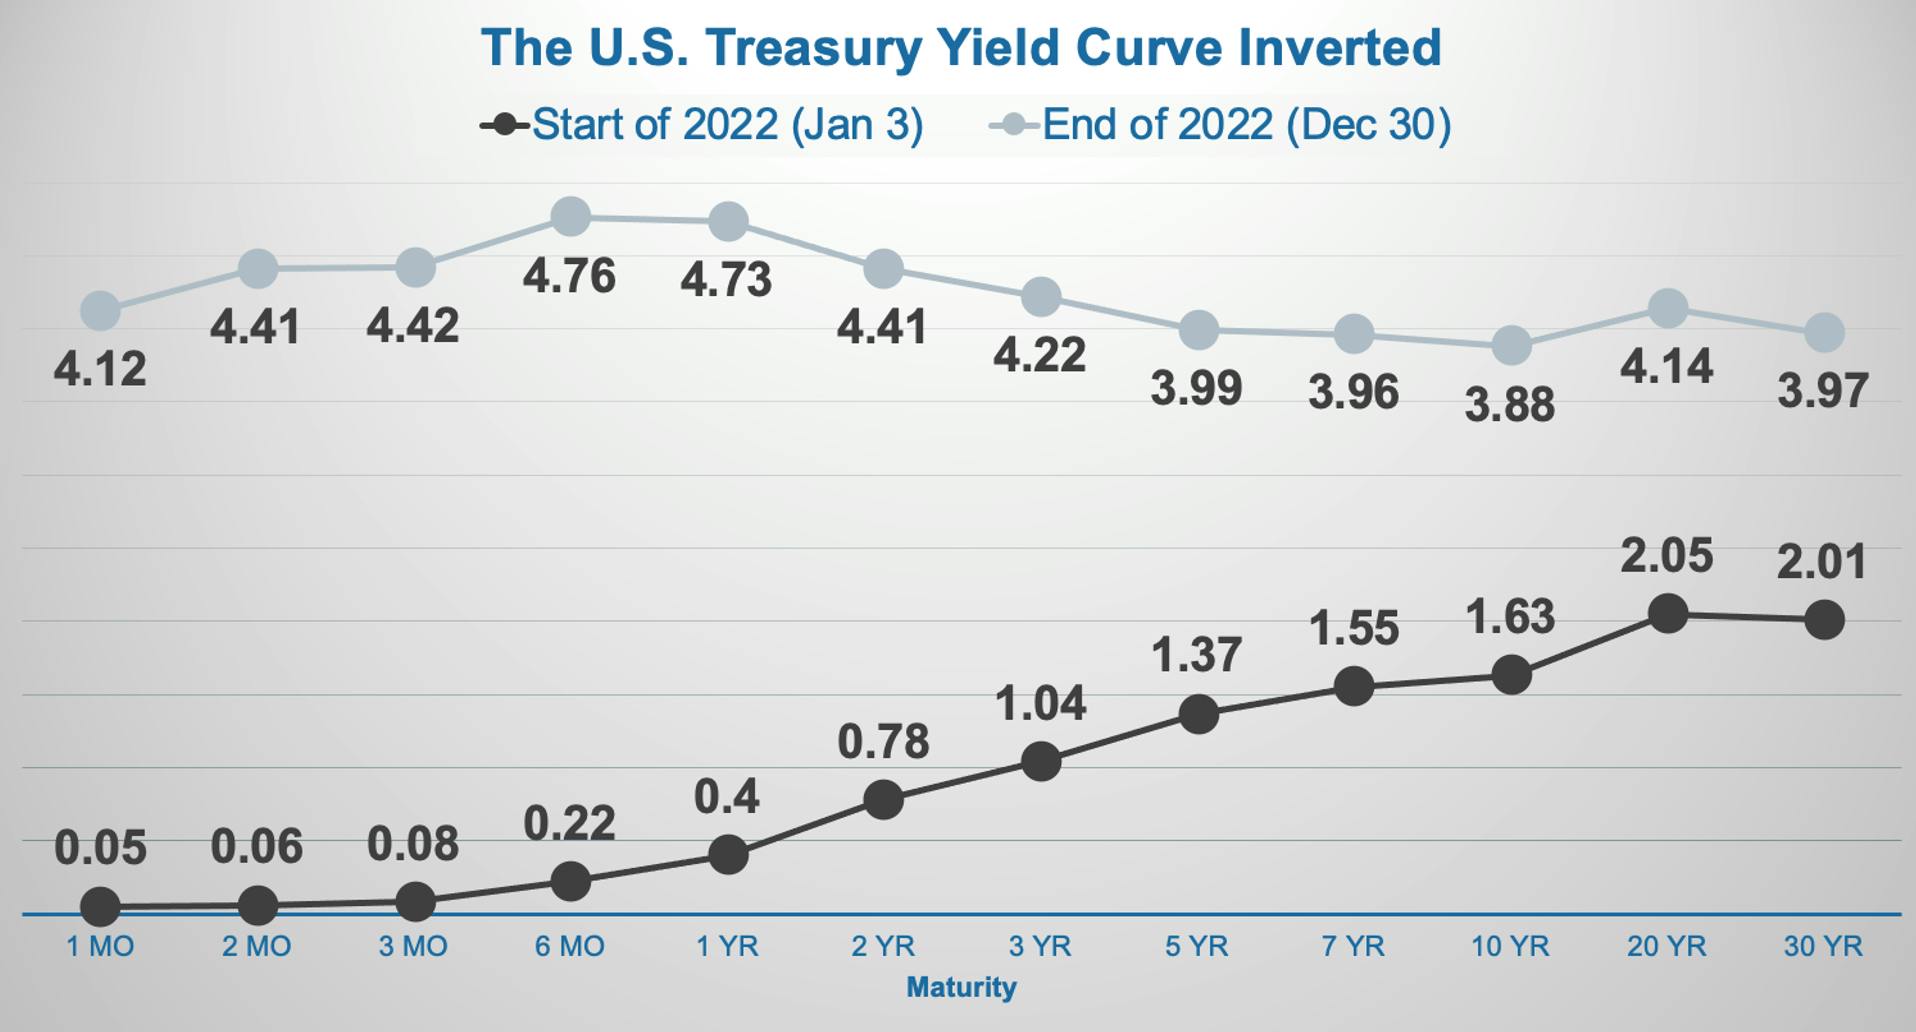
The turbulent financial markets have caused skepticism to set in among bond market investors. The shape of the yield curve—that is, the difference in yields offered by bonds across the spectrum of short-, mid- and long-term maturities—has been another highly accurate economic indicator. In good economic times, the yield curve should slope upward, with the yields for short-term bonds low and yields for long-term bonds higher.
Sometimes, the curve “inverts” and the yields for short-term bonds are higher than those available with long-term bonds. An inverted curve usually happens when people are expecting the economy to go through a prolonged period of weakness. After 2021 delivered a normally shaped yield curve, the curve for U.S. Treasury yields had inverted by the end of 2022. (See Exhibit 7.) That may be an indication that 2023 could be another difficult year for the economy and financial markets.
Exhibit 7: The U.S. Treasury Yield Curve Had Inverted by the End of 2022
What to Expect in 2023
After such a difficult year, many investors are bracing themselves for what could happen throughout 2023. The views from the experts—the economists who make predictions—are not promising. As noted above, nearly two-thirds of the economists surveyed by The Wall Street Journal believe the U.S. economy will slip into a recession this year. The investment banking firm Goldman Sachs believes there is still a 35% chance for a “soft landing.” In that scenario, the Fed will manage to tame inflation and avoid slowing the economy to a degree that it would experience a prolonged period of negative growth. Many other asset managers, though, do not foresee that possibility. A survey by Bank of America showed that 92% of them expect 2023 will be characterized by “stagflation,” when high inflation persists even though economic growth is slow and weak.
The optimists can take hope in the fact that the Fed has already signaled it may slow the pace of interest rate increases if the rate of inflation appears to be tapering. Even though inflation remains elevated, recent indications are that it is moving in the right direction—downward.
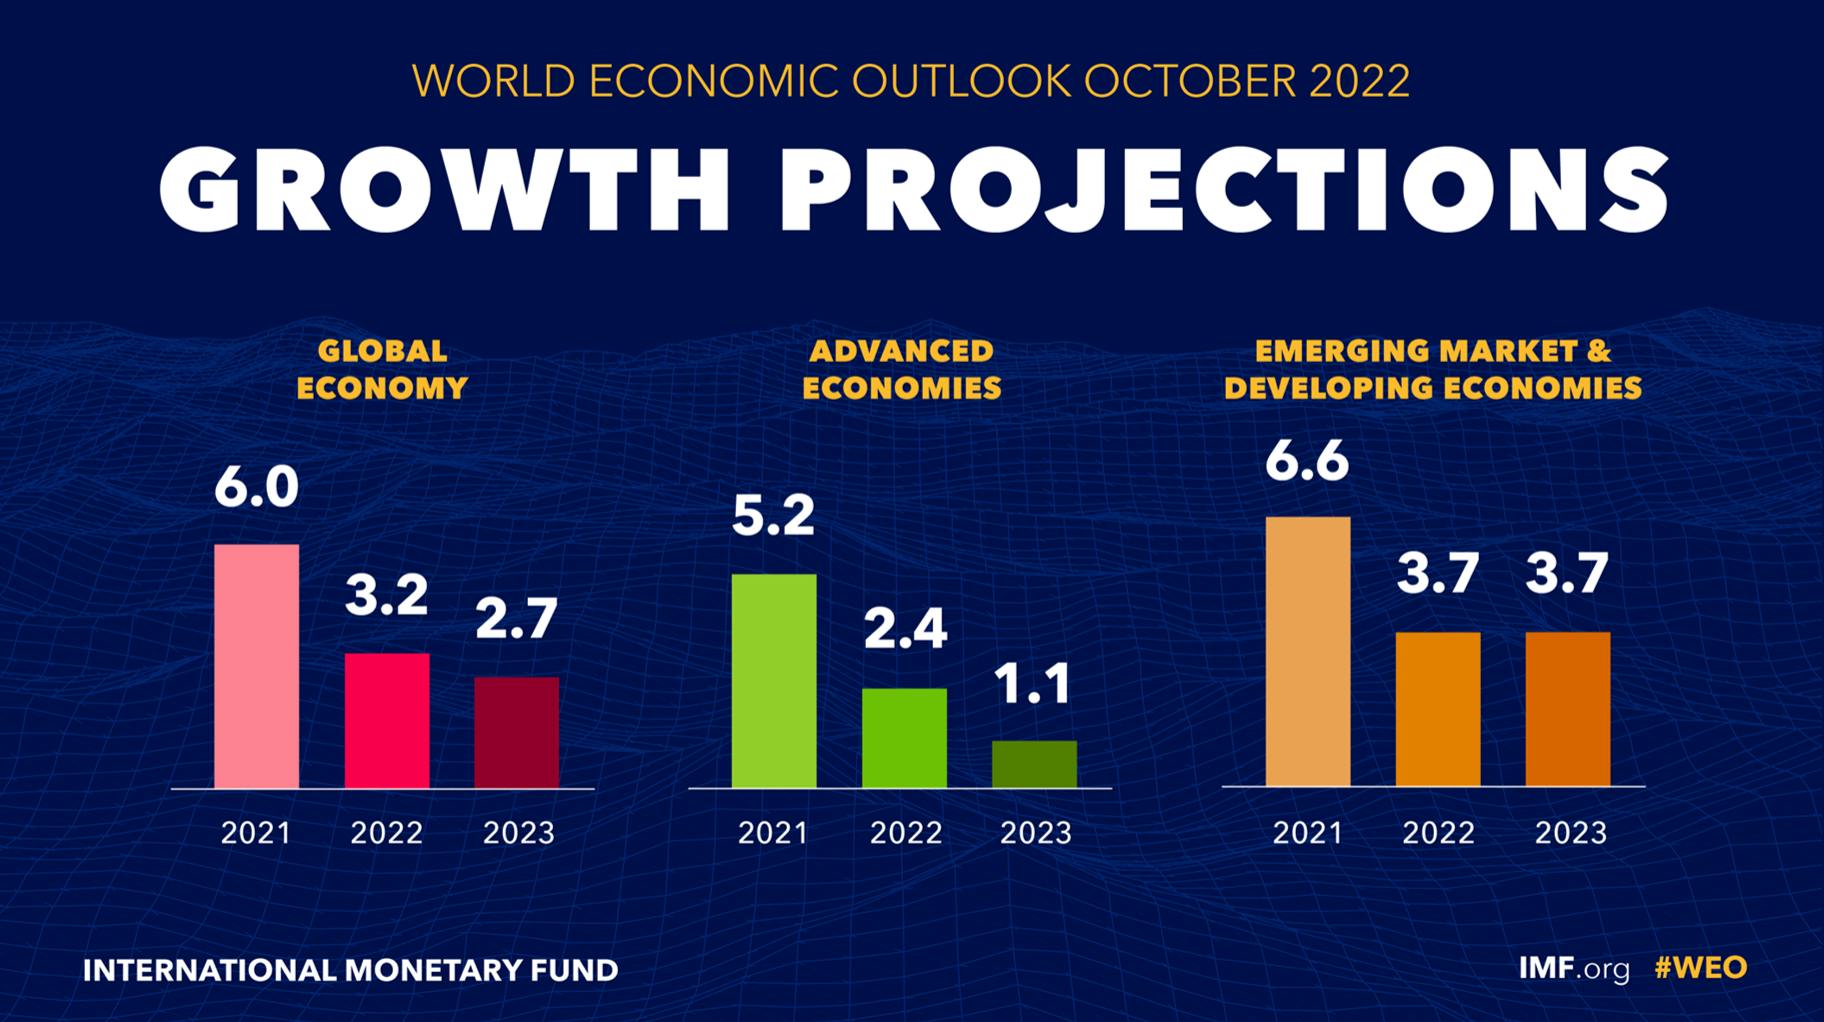
Even if the U.S. avoids a recession, the pace of economic growth may still be slow. For investors, who diversify internationally, however, higher growth might be obtainable overseas, particularly in emerging markets. The World Economic Forum predicts slow growth for 2023 in advanced economies, which comprise the United States, Canada, Japan, Australia, and Western European countries. (See Exhibit 8.) It expects growth in emerging markets to be higher than what developed markets experience, while still not anticipating gains for these countries at the robust levels seen in 2021.
Exhibit 8: World Economic Forum Growth Projections
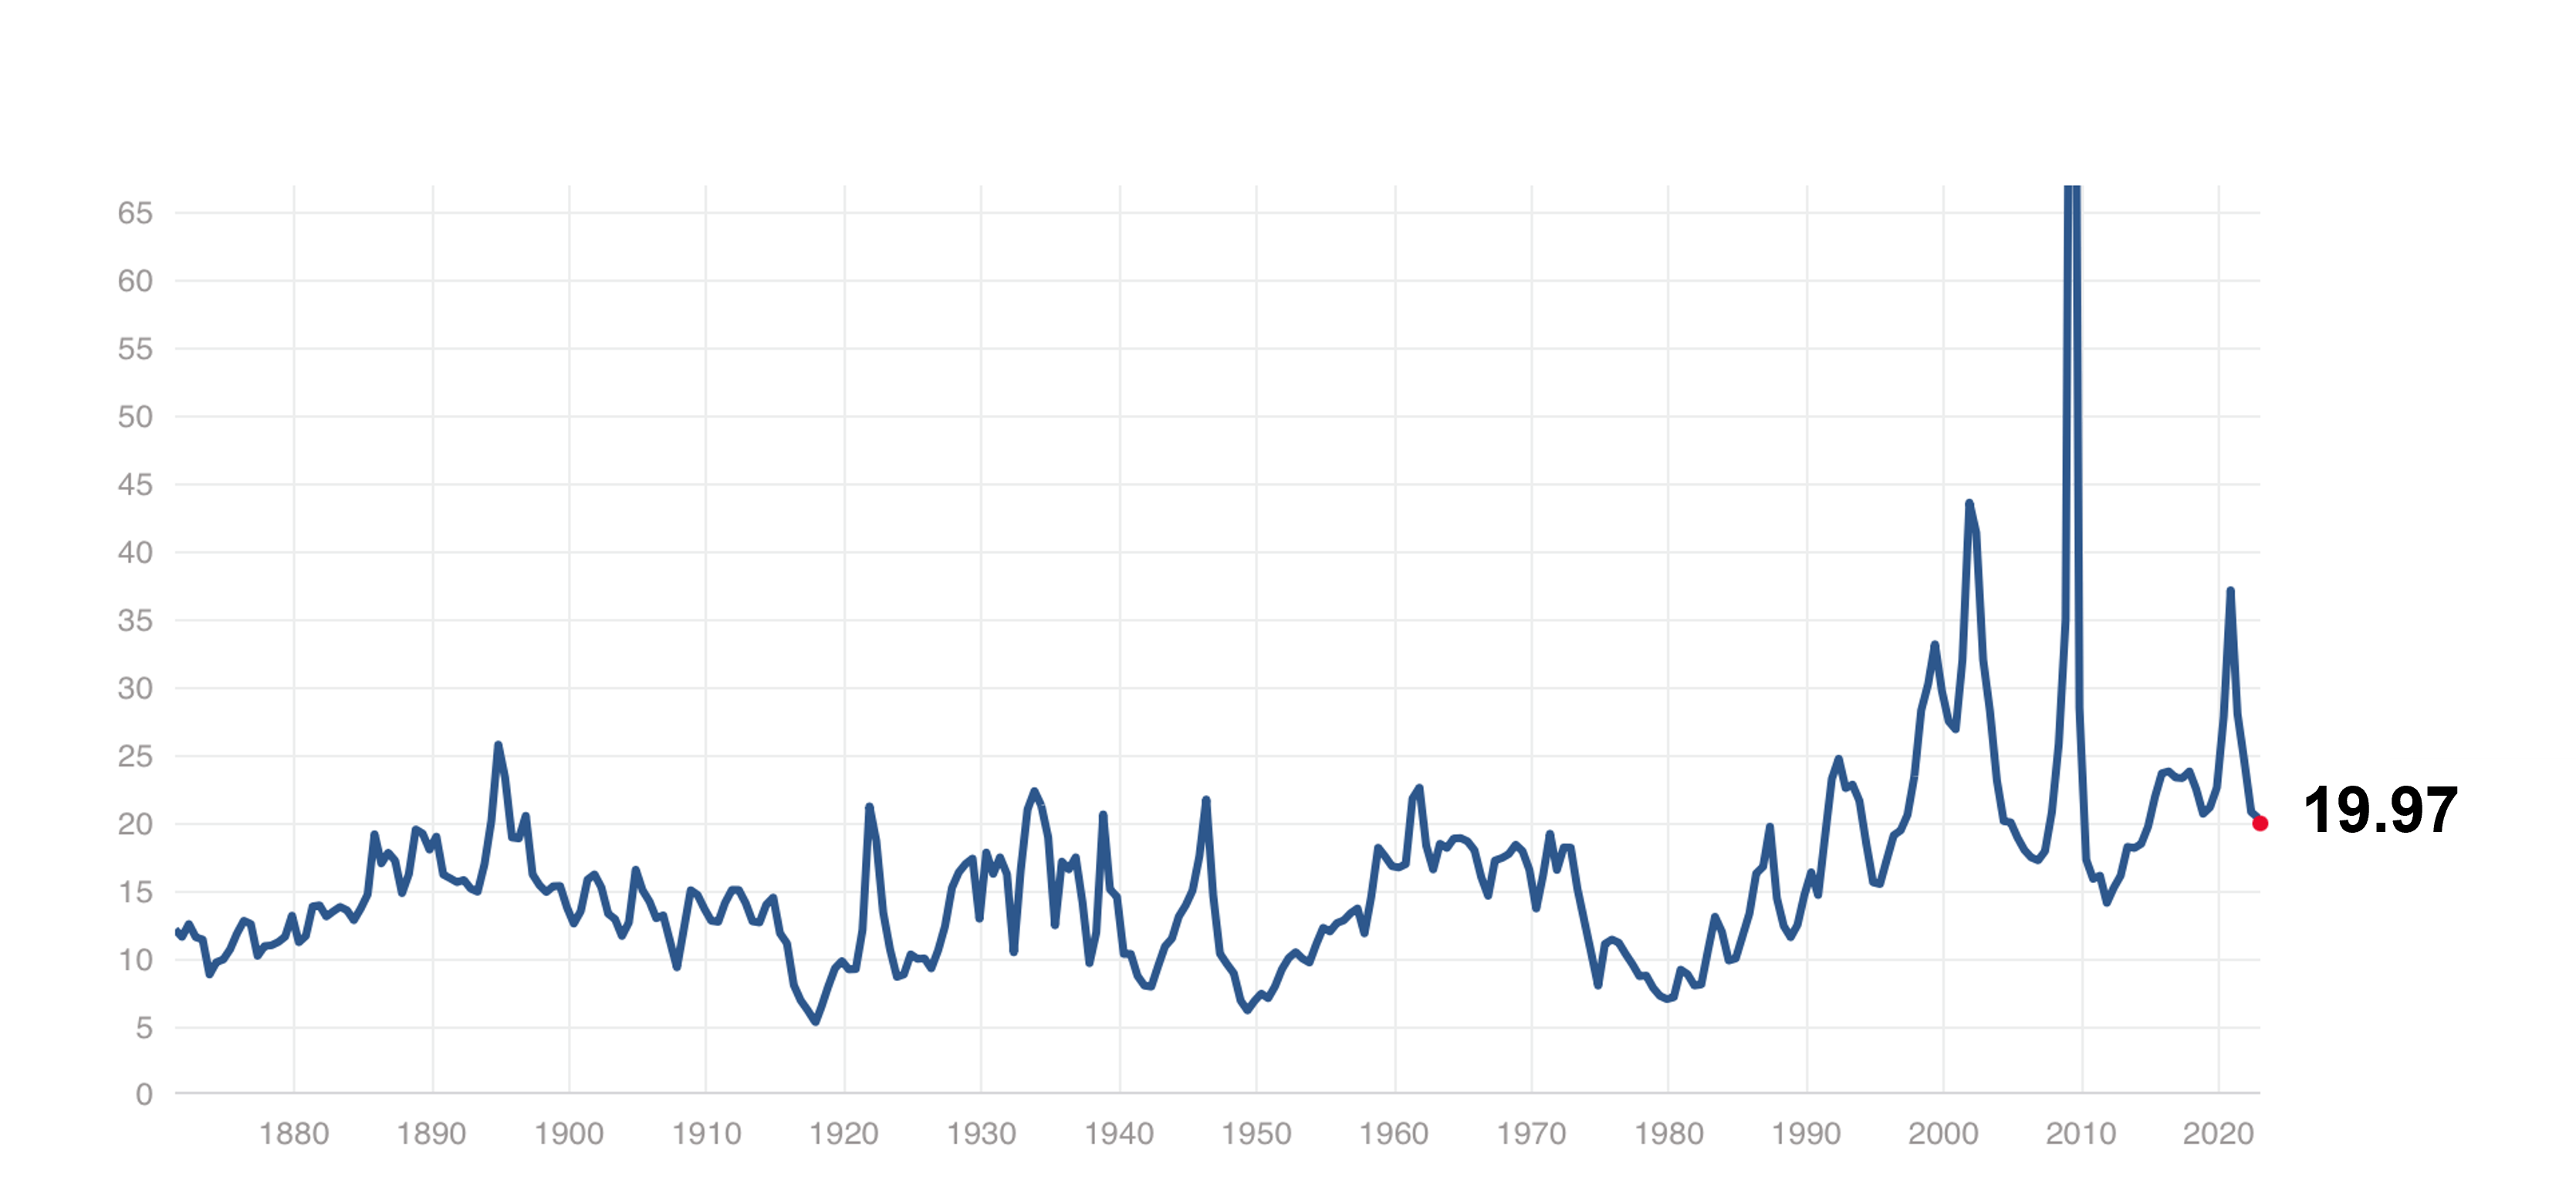
The state of the economy will inevitably impact the stock market. The market is generally forward-looking, so it could rally even before there are clear signs that the economy has rebounded. Stock market downturns also typically occur when stock prices have become elevated. Some excesses in the market may have been wrung out in 2022. Stocks’ price-to-earnings ratios had retreated by year-end, but they are still above the historical average of 14.91 (See Exhibit 9.)
Exhibit 9: Stocks Have Become Less Expensive on a Price-to-Earnings Basis
(as of December 30, 2022)
While providing no guarantees for the future, history can offer some consolation for concerned investors. Bear markets, defined as a 20% or more sustained decline in stock prices, typically have not lasted more than a year, as Exhibit 10 shows. Since 1946, only one bear market exceeded 12 months. That occurred from September 1976 to March 1978 in a period of significant stagflation. Perhaps even more reassuringly, none of the bear stock markets over that nearly 80-year period were immediately followed by a recession.
Exhibit 10: Bear Markets Typically Have Not Been Prolonged
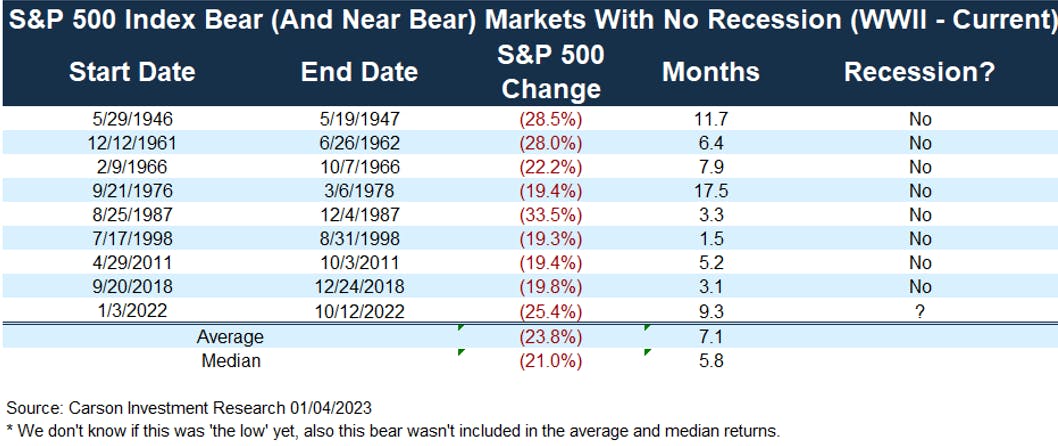
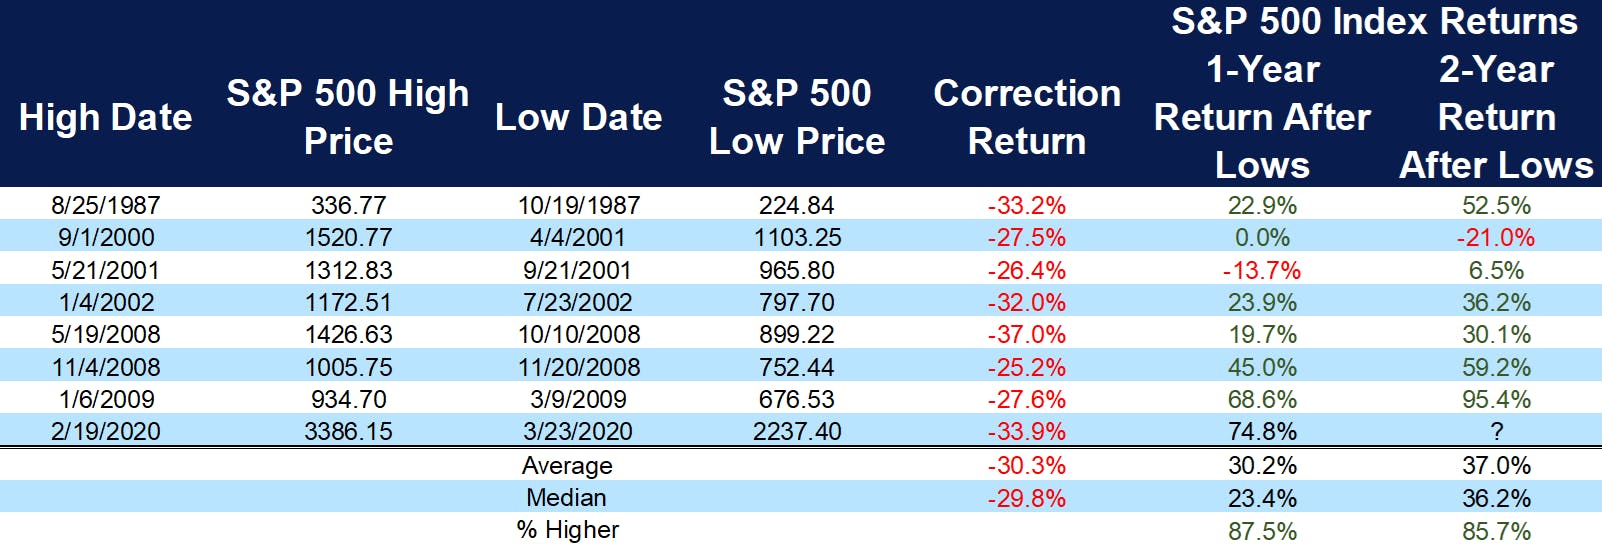
Exhibit 11: Stocks Have Tended to Do Well After Bear Markets
1- and 2-year stock market returns after bear markets since 1980.
Patience Is Often the Best Long-Term Strategy
Economic and market indicators rarely offer clear, across-the-board signals of what will happen next. The new year could prove to be another challenging one for both the economy and financial markets. Still, the stock market has historically been the best source of long-term growth for investors. For those who have goals, like retirement and college savings, that are still many years away, the best strategy is often to wait out the short-term turbulence.
Even for those who have reached their goals, like investors who are already retired, it may not be wise to upset the apple cart. Entirely rethinking your financial plan amid a market downturn could have consequences. With today’s long life expectancies, retirees still need growth in their portfolios for several decades. People who act hastily often end up having regrets once the market rebounds. Shifting to the sidelines is difficult because you may sell at a low point, and capture all the markets’ losses, and then get back in only after the recovery has begun and prices are higher.
It is always important to remember that the economy and markets are cyclical, and downturns inevitably occur. Investors generally fare best when they don’t experience too much stress over what they can’t control and instead focus on what they can—staying calm, avoiding panic-selling, and remaining committed to a long-term plan tailored to their needs. As always, Trinity Wealth Management is available to help investors navigate difficult markets and stay on course for their long-term objectives.
The commentary on this website reflects the personal opinions, viewpoints, and analyses of the Trinity Wealth Management, LLC employees providing such comments, and should not be regarded as a description of advisory services provided by Trinity Wealth Management, LLC or performance returns of any Trinity Wealth Management, LLC Investments client. The views reflected in the commentary are subject to change at any time without notice. Nothing on this website constitutes investment advice, performance data, or any recommendation that any particular security, portfolio of securities, transaction, or investment strategy is suitable for any specific person. Any mention of a particular security and related performance data is not a recommendation to buy or sell that security. Trinity Wealth Management, LLC manages its clients’ accounts using a variety of investment techniques and strategies, which are not necessarily discussed in the commentary. Investments in securities involve the risk of loss. Past performance is no guarantee of future results.
Sources:
- “Gross Domestic Product, Fourth Quarter and Year 2022 (Advance Estimate),” Bureau of Economic Analysis, U.S. Department of Commerce
- “The Employment Situation – December 2022,” Bureau of Labor Statistics, U.S. Department of Labor
- “Dec. jobs growth beats forecast but slows M/M, unemployment falls to 3.5%,” SeekingAlpha.com, 1/6/23
- “Prices rose at a slower pace last month, the Fed’s favored inflation gauge shows,” CNN.com, 1/27/23
- “Personal Income and Outlays, December 2022,” Bureau of Economic Analysis, U.S. Department of Commerce, 1/27/23
- “Consumers say they’re feeling better about the economy. But they’re still planning for a recession.” CNN.com, 1/27/23
- “Economic News Release: Consumer Price Index Summary,” Bureau of Labor Statistics, U.S. Department of Labor, 1/12/23
- Source: Federal Reserve Bank
- “US stocks finish 2022 with another loss, ending the year down 20% in their worst performance since 2008,” Business Insider, 12/30/22
- Ibid.